Integrated Genomics Analysis
Comprehensive Integrated Analysis
While accurate sequencing data is important, advanced tools for sequence alignment, variant calling and database integration are crucial to translate genomics information into actionable interpretation. ACT Genomics integrates advanced annotation and visualization tools, coupling with public and proprietary databases to deliver comprehensive and comprehensible reports.
In addition to collecting data from multiple public genomic databases, ACT Genomics also conducted an in-house sequencing project to establish baseline data for technical noise filtering and polymorphism annotation. Through these efforts, ACT Genomics has successfully improved the accuracy of variant calling and annotation.
For clinical research projects, ACT Genomics provides integrated sequencing QC results, project-level variant summary, distribution pattern of non-synonymous mutations, as well as comparison of mutation spectrum of 5 selected genes with TCGA data as standard project report. To facilitate the research and publication process, additional statistical analysis such as group-wise variant comparison and survival analysis, including Kaplan-Meier analysis and Cox regression analysis, will also be performed if clinical data is provided.
Distribution of Non-Synonymous mutations by sample
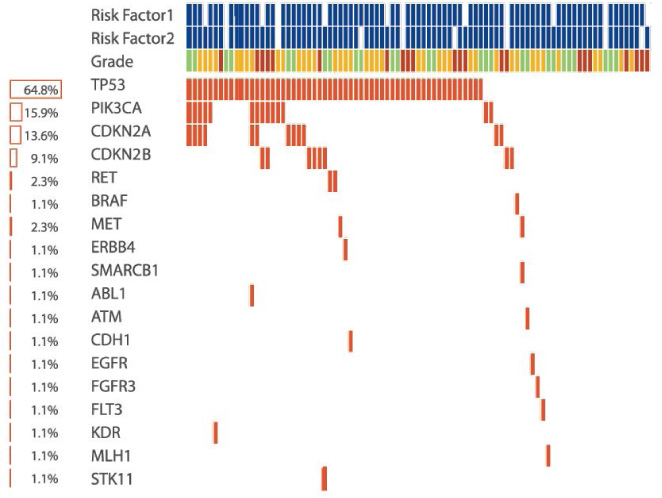
Summarize all genetic alterations observed in the study.
Typically used to show the mutation frequency of individual gene.
Can also depict gene-gene interactions such as co-occurrence and mutual exclusivity.
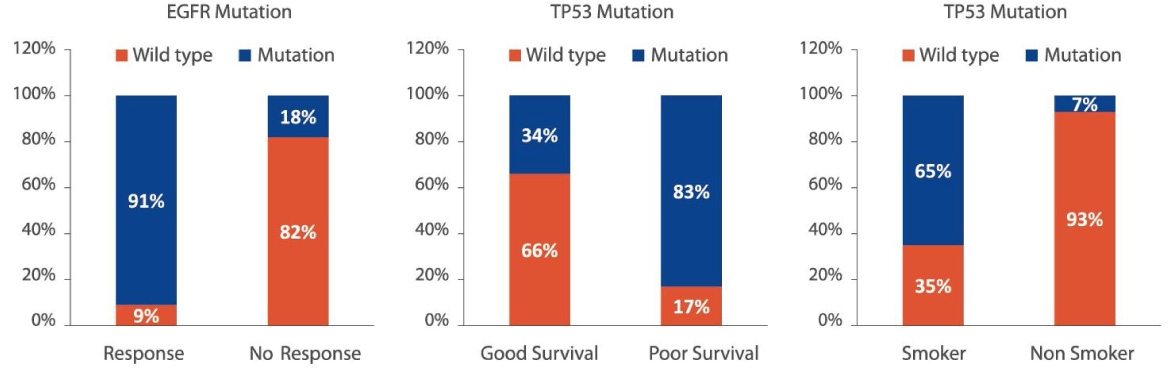
Group-wise comparison
Display the distribution and statistical significance of genetic alterations among different group.
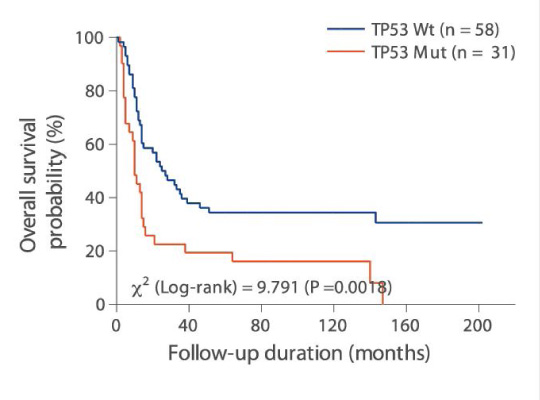
Kaplan-Meier analysis
Illustrate the effect of genetic alteration on patient’s survival.
Can also estimate median survival and statistical significance among different group.
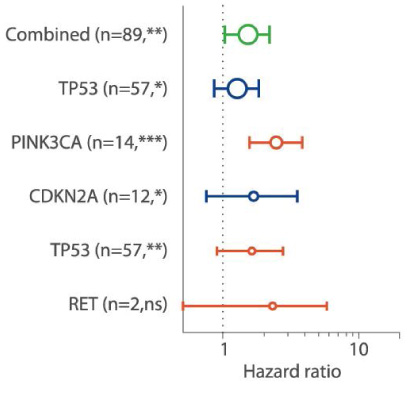
Cox regression analysis
Depict the impacts of genetic alteration on patient’s survival.
Can also estimate the hazard ratio of genetic alteration.
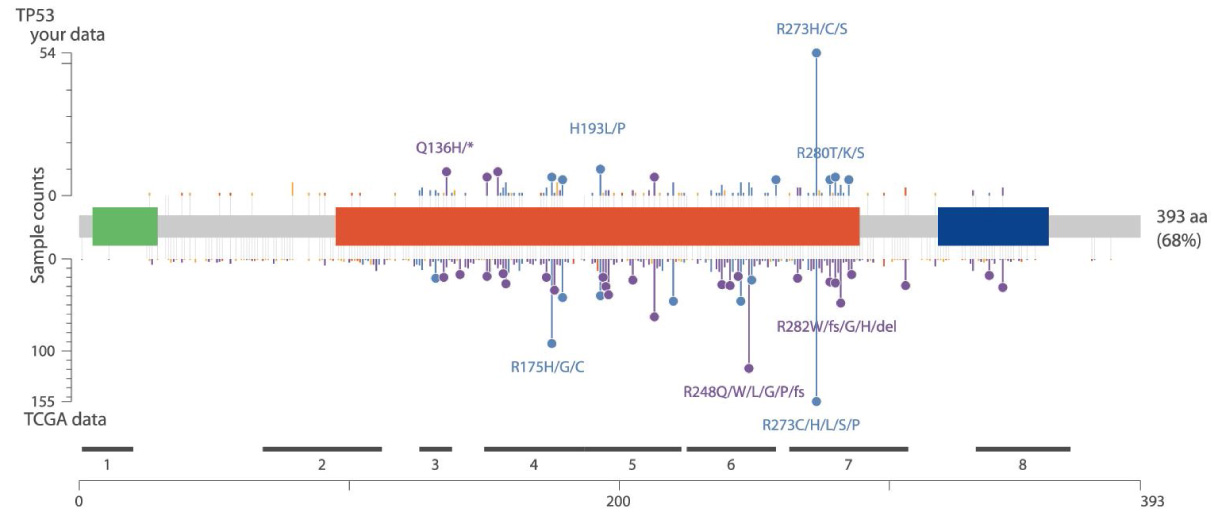
Comparing mutation spectrum of 5 selected genes with TCGA data
Illustrate the distribution of genetic variants on protein backbone with important domains highlighted.
Data from The Cancer Genome Atlas (TCGA) will be used as the comparison.